

Baseline Measurements 2 — Lab Guide
1 Overview
This week you will work with the apparatus you did not use last week and collect baseline data before you start stressing your cells. You will spend this week working with either the J-V (Current density-Voltage) apparatus or the EQE (External Quantum Efficiency) apparatus. Additionally, if you are working with the J-V apparatus, you will also take data on the light spectrum from your stressing LEDs.
2 Data Management Plan
Look over any feedback you received from your TA on the plan you turned in last week. Make adjustments to your file structure and file names if needed to address the feedback. Also, remember to do a weekly clean up of your files/directory structure to keep it in order.
Please do not change the name of your overall Team folder. Using the naming convention, we are able to scrape all the data into a single file that you will work with at the end of the semester and to deliver to NLR. If you have already changed it, please change it back according to the following convention:
Section XXX Day Time Team X (e.g., Section 102 Tuesday 10:05 am Team B).
3 Lab Activities
3.1 Retrieve Your Cell from the Stressing Station
All cells have been placed on the stressing stations just before the lab session starts so they can be close to the temperature they will need to be at for the measurements. You can retrieve your cell just before you are ready to take your measurements.
3.2 Data Collection and Analysis
The rest of the lab will be spent taking baseline data and completing analysis using those data.
Look at the Apparatus Schedule to determine which apparatus (J-V or EQE) your team is working with this week and then download the corresponding Apparatus guide and Colab notebook file from Canvas.
Use the directions in the apparatus guide to collect your data. Each team member should take a measurement for at least one pixel to gain experience with the experimental tools.
Once you have finished collecting your data make sure all data files have been uploaded to your team Google Drive folder. Refer to the schematic posted near the apparatus for the pixel numbering convention.
Once you have completed measuring all pixels work together to complete the analysis for your baseline data using the corresponding Colab notebook. After completing the notebook, each member of your team must submit an identical copy of the .ipynb file and PDF to Canvas by the due date listed on Canvas.
To convert your .ipynb to a PDF, use the Notebook to PDF online tool.
3.3 For Teams Working with EQE
Download the EQE time log and be sure to record timing for your cell and each pixel. You will record the time you remove your cell from its stressing station, the time you complete EQE measurements for each pixel, and calculate the elapsed time (Δt) between removal from the stressing station and completion of the measurement. You will record these values for every EQE measurement this semester. Please keep this file with your raw EQE data in your team Google Drive folder.
3.4 For Teams Working with J-V: Collect Stressor LED Spectrum
Follow the Spectrometer Guide to measure the spectrum of your team’s stressing LED.
Using the Stressor LED Spectrum Colab notebook from Canvas, complete the analysis for the data you collected. Each member of your team must submit an identical copy of the .ipynb file and PDF to Canvas by the due date listed on Canvas.
3.5 Set Cell Up in Stressing Station
After you have finished your data collection this week, it is time to begin stressing your cell.
- Find the correct stressing station for your Team.
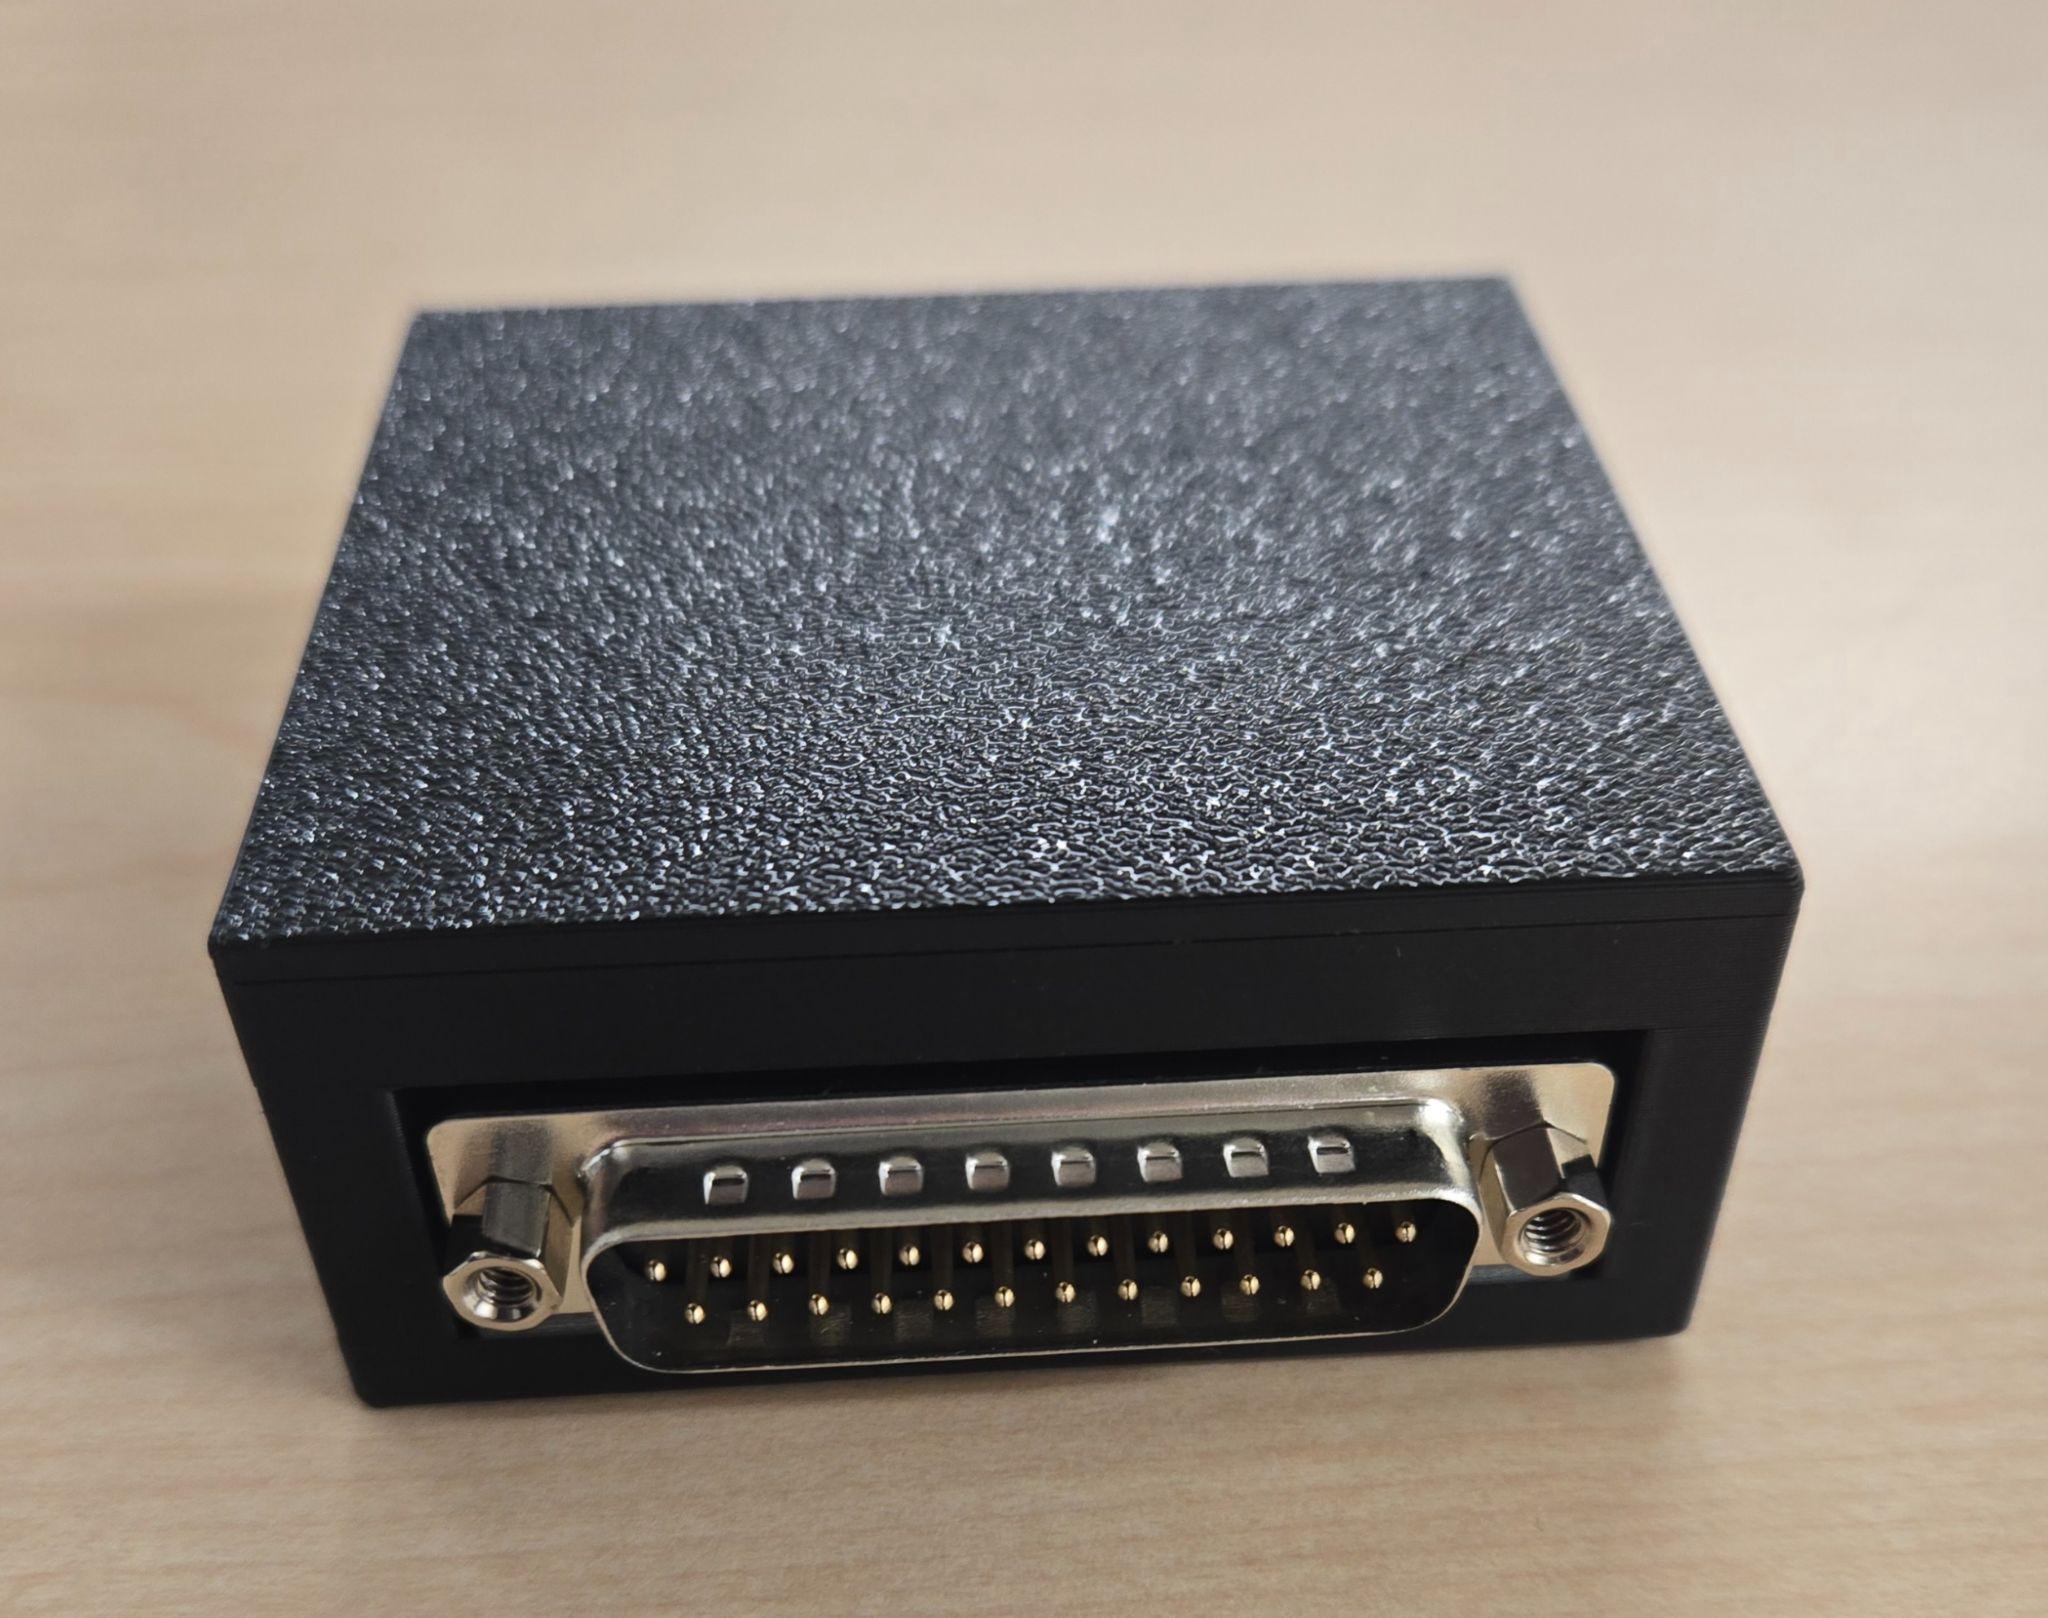
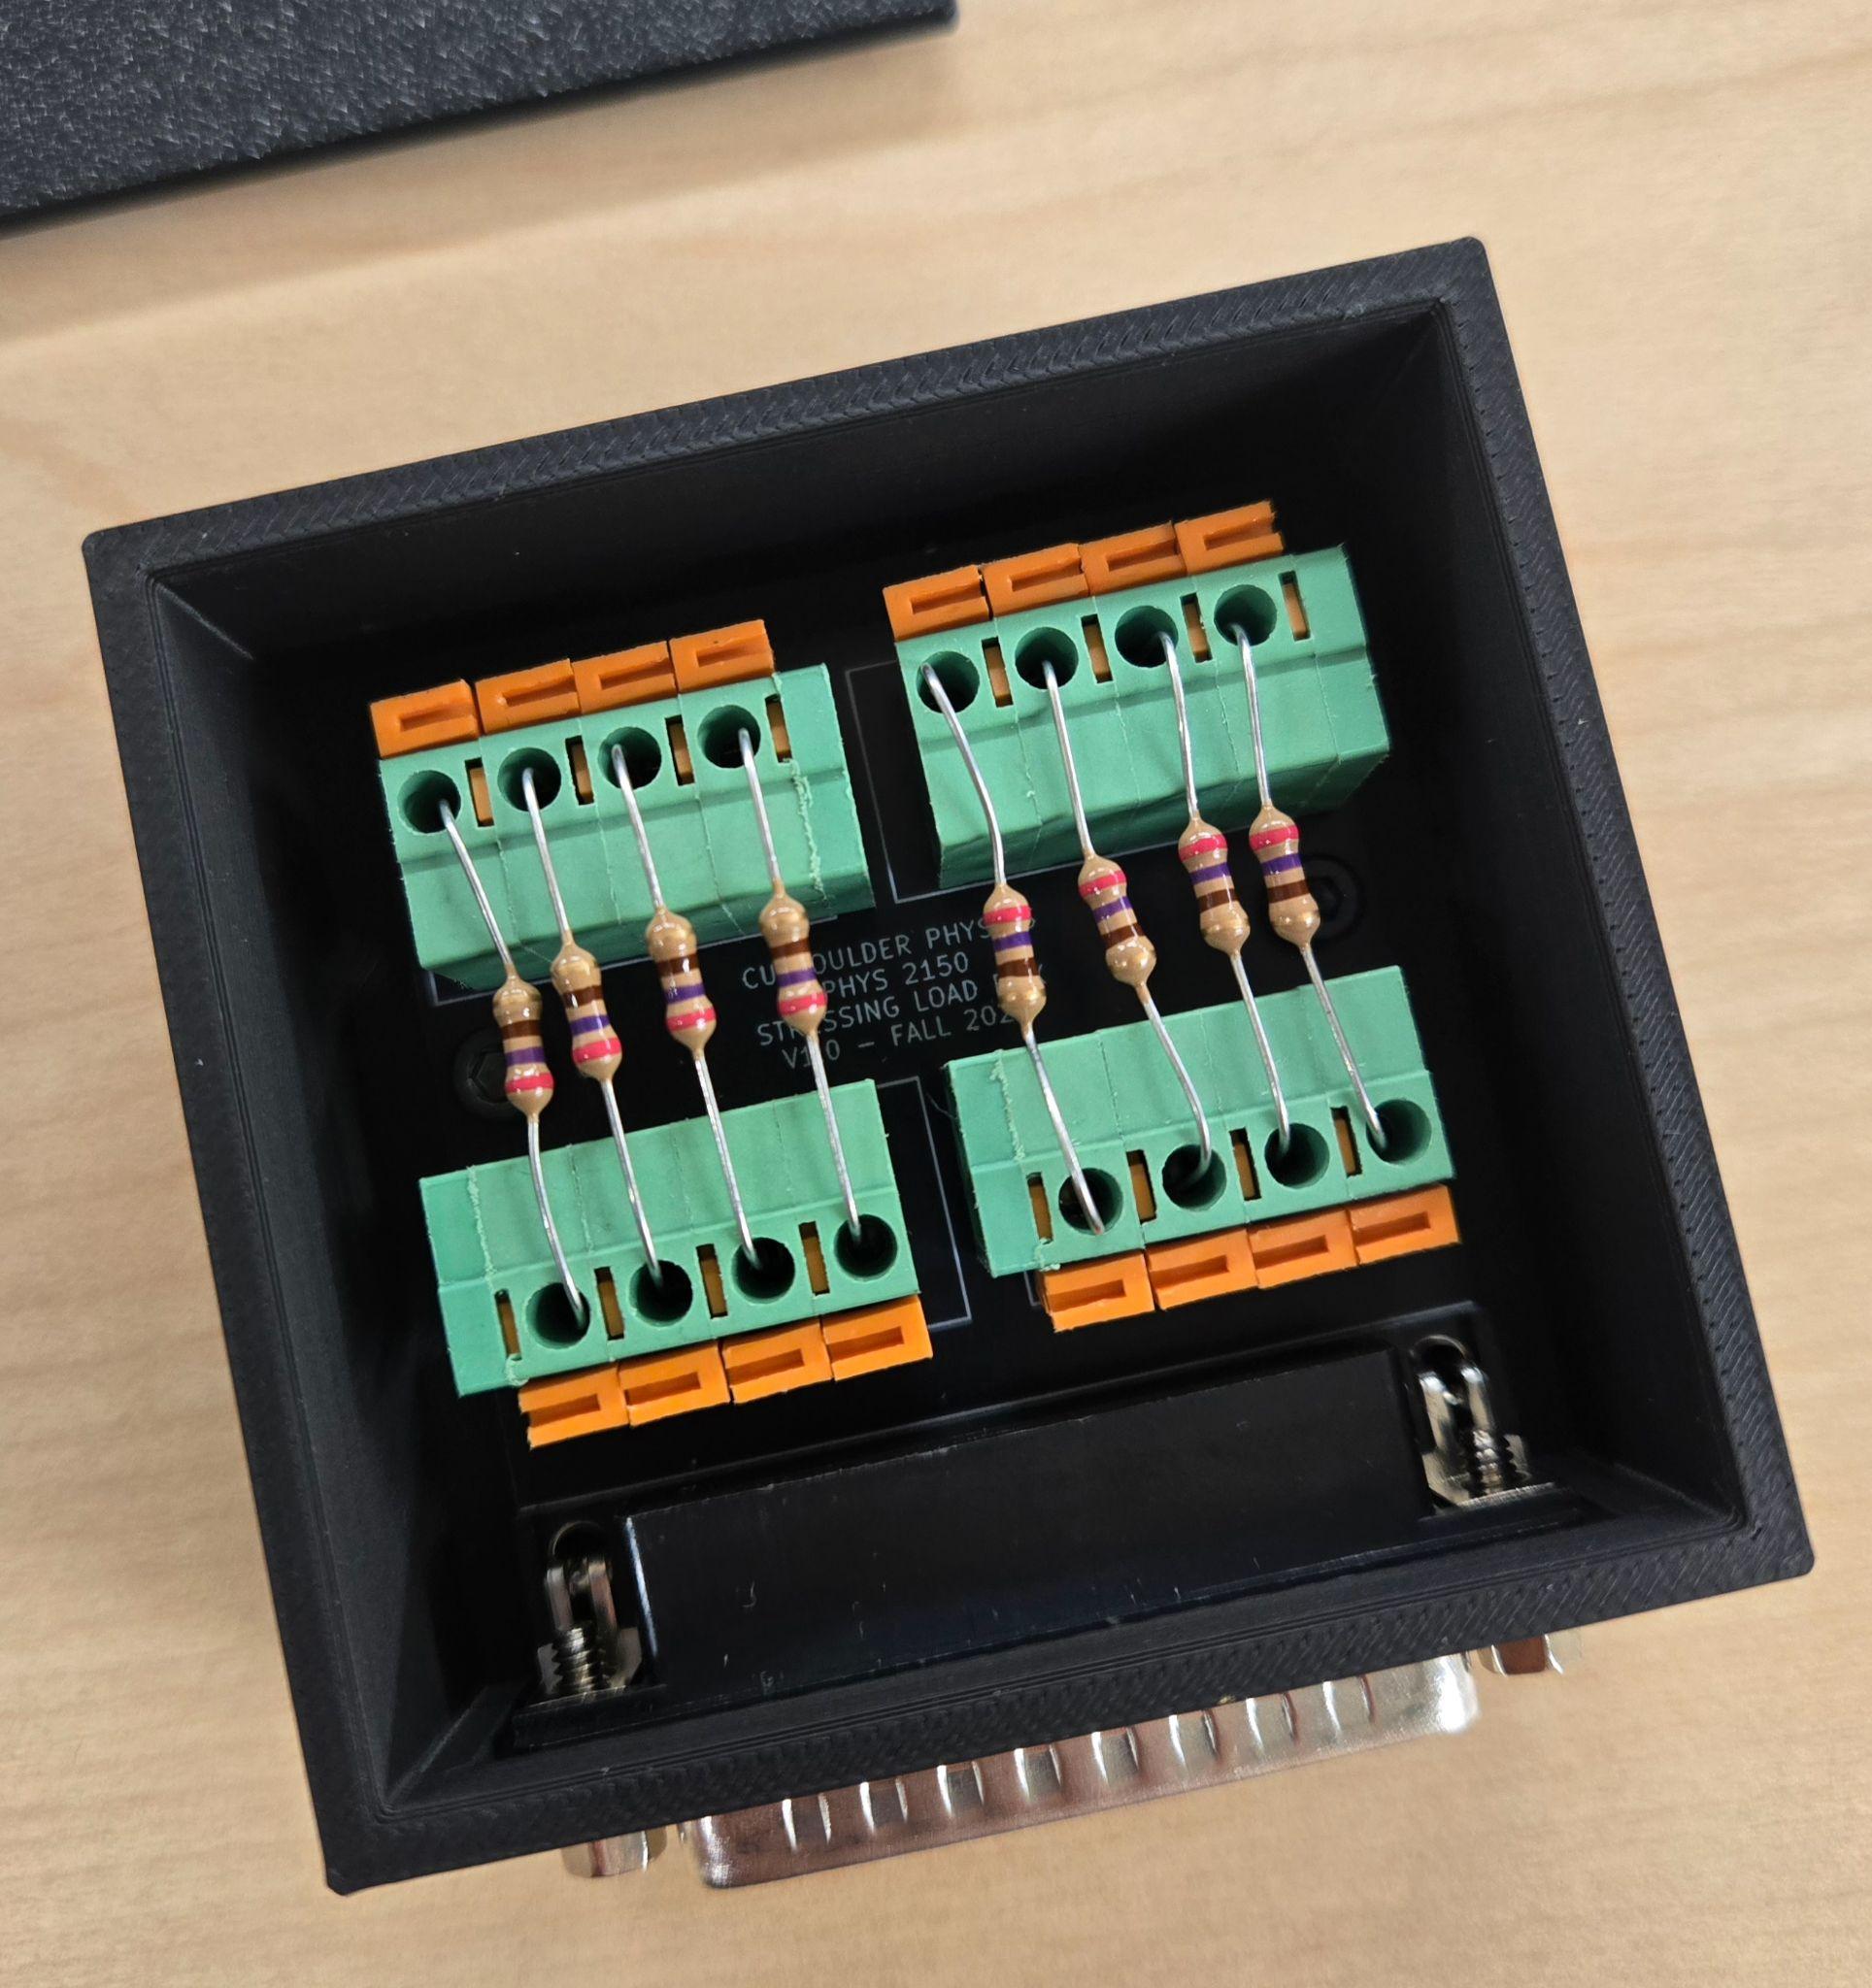
- Connect the load resistor box to the DB25 connector. This is just a box that connects a 270 ohm resistor across each pixel to serve as a load. The value was chosen to keep the pixel operating near the maximum power point.
- Place your cell in the alignment jig and snap the lid closed.
- Close the door on the station to make sure each cell is isolated from the light from other stressing stations.
4 Post-lab Activities
Please complete this week’s reflection by the due date listed on Canvas.