

Wind Energy Generation: Statistical Uncertainty
1 Overview
You will measure the voltage produced by an electric generator driven by a windmill. You will use your measurements and associated statistics to make comparisons to other measurements.
Keep all objects including your head away from the back of the fan.
2 Learning Goals
After completing this week’s lab, you should be able to:
- Describe how the number of measurements affects the values calculated for standard deviation (\(\sigma_x\)) and standard deviation of the mean (\(\sigma_{\bar{x}}\)).
- Explain the difference between \(\sigma_x\) and \(\sigma_{\bar{x}}\) and how to use each when reporting measurements.
- Decide how well two data sets agree with each other using \(\bar{x}\) and \(\sigma_{\bar{x}}\) from each set.
3 Explore: Data Acquisition and Histograms
Use a fan to drive a windmill connected to an electric generator. You will measure the voltage produced by the generator using a National Instruments USB data acquisition device. (See Figure 1.) The device is read by the PHYS 1140 Lab App — the same desktop app you use to clean up your notebook PDFs. Assemble your apparatus according to Figure 1, launch the lab app from the desktop, and open the Wind Energy Generation page from the lab selector.
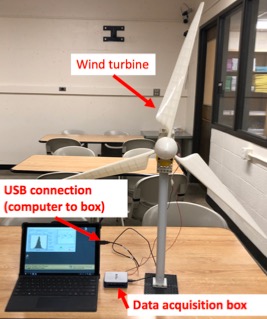
Turn on the fan, start taking data, and spend a few minutes exploring the app on your own — try different settings and see how they affect your data and plots.
Use your apparatus and measurements to answer the following questions in your notebook:
- Describe in your own words how changing the parameters at the top of the page changes your data acquisition and presentation.
- How does your choice of bin size change the histogram?
- How many measurements do you have to take to get a “good distribution” of measurements? Describe what criteria you used to evaluate if you had a “good distribution.”
- Copy a graph of your “good distribution” into your notebook using the copy button (the copy icon) below the plot. Make sure to include a caption.
Both lab partners should include all data (including graphs) in their notebooks. You can email (or transfer electronically by another means) the graphs between computers.
4 Predict and Discuss: How Statistics Change with More Data
Based on your initial observations and your knowledge of measurement statistics, make some predictions in your lab notebook: as you take more and more voltage measurements, how will the values of the mean voltage, \(\bar{V}\), standard deviation, \(\sigma_V\), and standard deviation of the mean, \(\sigma_{\bar{V}}\), change if at all?
Compare your reasoning to another group of students at your Pod.
Record any differences in reasoning between the two groups and whether you decided to change your reasoning. If your reasoning was identical, record that as well.
If you change your reasoning, don’t remove what you have already entered in your notebook. You won’t be marked off for recognizing your mistakes; this is part of learning in the lab!
5 Test Predictions: Validating Your Reasoning
Now, test the predictions you made in the previous section using measurements from your apparatus. First, discuss with your partner what data you will take and why it will help you test your predictions.
Record the data you collected to test your predictions and describe how those data either validate or contradict your previous predictions. Make sure to label all of the data so others can understand what you have done. Record any changes to your reasoning from Section 4.
6 Gather and Analyze Data: Best Estimate of Voltage
Now that you understand how the number of measurements affects your measurement statistics, take a set of data to precisely determine the mean voltage (and its uncertainty).
Record the data in your notebook, including the statistics, number of measurements, and a histogram of your data. Report your best estimate of the mean value of the voltage produced by your windmill, including the uncertainty in your measurement.
Answer the following in your lab notebook:
- Does your data set look like you expected? Explain your reasoning.
- If you took a lot of data, some data points have values that are much larger or smaller (several standard deviations) than the mean value. Looking at your histogram, should you consider those as outliers and throw them out of the data set? Explain your reasoning.
7 Compare: Testing the Normal Distribution
In a large, “normally” distributed data set, 68% of the measurements will lie in the range from \(\bar{V} - \sigma_V\) to \(\bar{V} + \sigma_V\).
Perform 10 voltage measurements and determine how many fall within the range from \(\bar{V} - \sigma_V\) to \(\bar{V} + \sigma_V\). Record your data and results in your notebook.
To pull your individual measurements out of the app, click Save Data and use one of the options under Datapoints — Download CSV saves a file you can open in Excel, and Copy to Clipboard lets you paste the values directly into Excel or your notebook.
Record how many of your 10 measurements fell within the range on the shared tablet on the lab wall connected to the TV.
Record the results of your lab section as a whole in your notebook once most of the students have entered their values. Do the results of the entire section indicate that this experiment has a normally distributed statistical spread?
8 Draw Conclusions: \(\sigma_x\) vs. \(\sigma_{\bar{x}}\)
Answer the following questions in your notebook:
- When everyone in your section did 10 voltage measurements, some probably reported that 6.8 of their measurements did not fall in the range from \(\bar{V} - \sigma_V\) to \(\bar{V} + \sigma_V\). Did these experimenters make a mistake? Explain.
- In your own words, what is the difference between standard deviation (\(\sigma_V\)) and standard deviation of the mean (\(\sigma_{\bar{V}}\))?
- If someone asked you “what is the voltage produced by your windmill?”, which uncertainty would you report with your answer — \(\sigma_V\) or \(\sigma_{\bar{V}}\)? Explain your reasoning.
9 Reflect
Think through everything you did during this lab.
Briefly do the following in your lab notebook:
- Describe something that worked well when doing the lab activity today.
- How did you contribute to this success?
10 Appendix A: Statistical Definitions
Let \(x_1, \ldots, x_N\) denote \(N\) separate measurements \(x\). Then, we define the following statistical quantities:
\[ \bar{x} = \frac{1}{N} \sum_{i=1}^{N} x_i = \text{mean} \] (1)
\[ \sigma_x = \sqrt{\frac{1}{N-1} \sum_{i=1}^{N} (x_i - \bar{x})^2} = \text{standard deviation} \] (2)
\[ \sigma_{\bar{x}} = \frac{\sigma_x}{\sqrt{N}} = \text{standard deviation of mean} \] (3)
The mean (average) is the best estimate for central value of our measurements. The standard deviation is a measure of the spread in measurements. The standard deviation of the mean is a measure of the uncertainty in the mean value.