

Tennis Ball Launcher: 2D Projectile Motion
1 Overview
You will measure the launch velocity of a tennis ball launcher (as you did last week) and then use these measurements to predict the range of a launch at an angle. You will create a “target” on the ground based on the mean and spread you find from the vertical launch. Finally, you will test your predictions for a launch at an angle.
2 Learning Goals
This week’s lab reinforces the learning goals from Labs 3 and 4. In particular, we are emphasizing:
- Understanding what \(\sigma_x\) means for the probability of a single measurement of \(x\).
- Understanding when to use \(\sigma_{\bar{x}}\) and when to use \(\sigma_x\).
3 Gather and Analyze Data: Muzzle Velocity
Start by measuring the launch velocity of your launcher like you did last week. Use the maximum height technique (\(v_0 = \sqrt{2 g h_m}\)) from Lab 4.
Keep the following in mind as you measure:
- Be careful to make your launches as consistent as possible. To do this, consider having just one person in your group operate the launcher throughout this activity, doing exactly the same things each time.
- Make at least 10 measurements.
- Don’t forget to take into account the initial height of the ball.
Don’t forget to report the uncertainty of the mean velocity.
Embed a new Excel spreadsheet in your notebook (Insert > Spreadsheet > New Excel Spreadsheet) and record your measurements. Report your mean launch velocity and its uncertainty in your notebook.
4 Predict: Range and Target Zone
Choose an angle between 30° and 60° and set your launcher to this angle using a protractor or magnetic angle finder. Place pieces of tape on the ground to help reorient your launcher in case it gets bumped.
Locate the position on the ground directly below the launch position and mark it with a piece of tape. Measure the height of your ball at its launch position. Be careful about which part of the ball you measure from: when the ball lands its center is not at ground level.
Using the stylus, draw a figure of your setup and label your launch angle and launch height on your figure. Add a caption describing the setup.
In your Excel spreadsheet, input the range equation derived in the prelab (see Section 9) so you can predict the range of each launch. Copy the following formula into an empty cell in your spreadsheet:
=V*COS(RADIANS(theta))/9.796*(V*SIN(RADIANS(theta))+SQRT(V^2*SIN(RADIANS(theta))^2+2*9.796*h))Replace the variables with cell references for your data:
V— the cell containing your calculated launch velocity (m/s)theta— the angle of your launcher (degrees)h— the initial height of your ball in the launcher (m)
Use absolute references for values that are the same across all rows: put a $ before the column letter and row number (e.g., $B$1) so that cell stays fixed when you drag the formula down, while ordinary references like B2 update row by row. See Lab 1 if you need a refresher on writing formulas.
Your goal is to create a target with pieces of tape in which you expect 68% of your launches to land.
Compute the mean, standard deviation, and standard deviation of the mean of these ranges. Where will you put your pieces of tape? Label those positions on your diagram.
Wait to actually put your tape on the ground until after the “Discuss” section.
5 Discuss: \(\sigma_x\) or \(\sigma_{\bar{x}}\)?
Pair up with another group in your Pod, and discuss your answers to the questions in Section 4. In particular, discuss whether you used the standard deviation or the standard deviation of the mean to decide where to put your pieces of tape. If you want to make any changes to your procedures or answers:
Record any changes to your procedures or answers in your lab notebook.
If you made a mistake, do not remove what you have already entered in your notebook. Just make a note indicating your correction. You won’t be marked off for recognizing your mistakes!
6 Gather and Analyze Data: Testing Your Prediction
Now, you will test out your prediction! Place pieces of tape on the floor in front of your launcher to create a target of the size you predicted.
After placing your target, perform 10 launches.
Record how many of your launches fell within your target.
Record how many launches fell within your target on the shared tablet on the lab wall connected to the TV.
Record the results of your lab section as a whole in your notebook once most of them have been input.
7 Draw Conclusions: Consistency of Predictions and Results
Record your responses to the following in your lab notebook:
- Did your own measurements agree with your prediction for the range of your launcher? Hopefully you see that the answer to this question is not black and white! Based on your statistics, make a statement about the consistency of your experiment with your prediction. Refer to the Lab 4 guide as necessary.
- Were the experimental results of your lab section, taken as a whole, consistent with your prediction? Explain.
8 Reflect
Briefly, record your responses to the following in your lab notebook:
- Describe a challenge you encountered today while doing the lab.
- How did you respond to this challenge?
9 Appendix A: Derivation of Range Equation
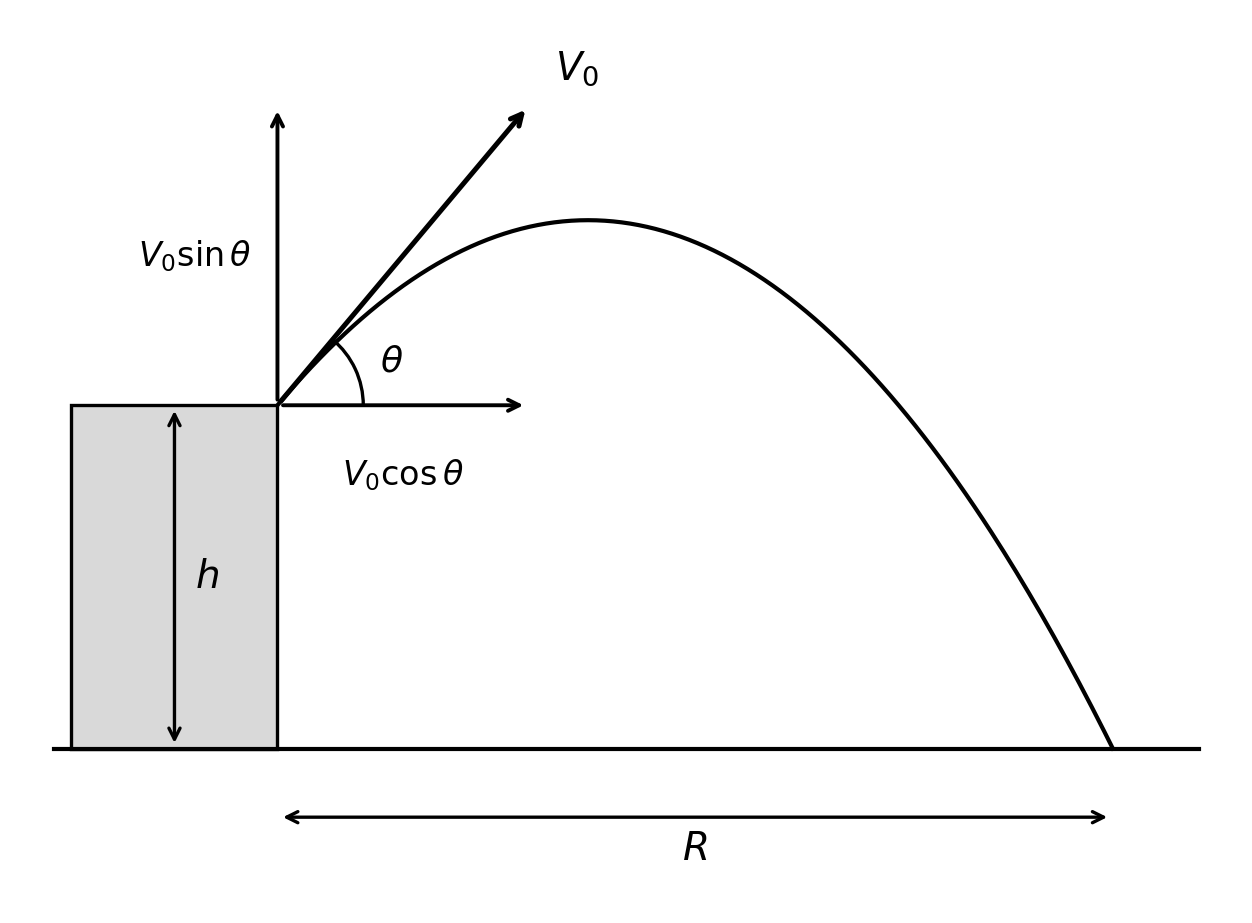
The range of the projectile, \(R\), is given by the initial velocity in the \(x\)-direction times the time-of-flight.
\[ R = V_0 \cos\theta \; t \]
The time can be calculated by considering the motion in the \(y\)-direction as follows.
\[ y = y_0 + V_{y,0} \, t - \frac{1}{2} g t^2 \]
where \(y_0 = h\), \(y = 0\), and \(V_{y,0} = V_0 \sin\theta\). This leads to the following equation.
\[ 0 = y_0 + V_0 \sin\theta \; t - \frac{1}{2} g t^2 \]
Solving this equation for \(t\) and choosing the larger root gives:
\[ t = \frac{V_0 \sin\theta}{g} + \frac{\sqrt{V_0^2 \sin^2\theta + 2gh}}{g} \]
Using this time for the range gives the following equation.
\[ \boxed{R = \frac{V_0 \cos\theta}{g} \left( V_0 \sin\theta + \sqrt{V_0^2 \sin^2\theta + 2gh} \right)} \]